GPX-Viewer |
Inhaltsverzeichnis
Siehe auch: GPX
GPX-Viewer
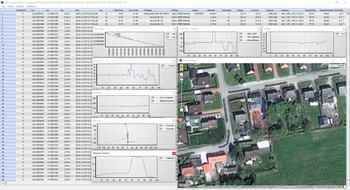
The GPX-Viewer is a simple Tool for the PC to display GPX-Logfiles recorded by the Mikrokopter
Funktions
- Display of all telemetry data of the Kopter
- Errors shown colored(e.g. deviations of he magnetic value)
- Statusbits of the Mikrokopter will be evaluated
- GPX-file can be exported to Google Earth
- Additional Information from the GPX-File can be displayed (e.g Settingsinfo, Licenseinfo, Firmwareinfo)
- units will be added to the data and converted if possible (e.g. Altitude)
- You can build own Charts of the values in the GPX-file
- The columns can be re-alligned
The GeoData can be exported to Agisoft Photoscan und Pix4D
Download
You can download the latest Version of the GPX-Viewer here: Download GPX-Viewer
Getting the Logfile
The flightdata are stored on the SD-card on the NaviCtrl(see here). If there is no SD-card plugged into the NaviCtrl, no data will be recorded. To load the logfile from your Kopter it has to be connected to you PC. Therefore you can use the MK-USB.
![]() Be aware: You only can use SD-cards with a capacity of max 2GB. And it has to be FAT16 formatted!
Be aware: You only can use SD-cards with a capacity of max 2GB. And it has to be FAT16 formatted!
In the KopterTool you see this this button  . After clicking on this button an explorer opens where you can download the desired logfile.
|
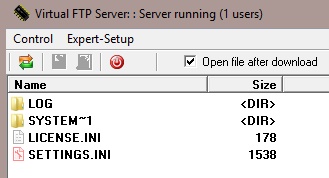
In the main folder of the SD-card you see the settings.ini, a folder for the logfiles and more possible files. Here you click on the folder LOG. |
|
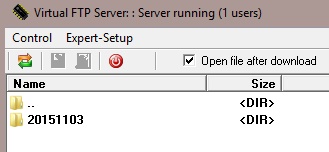
In this subdirectory you see folders which names contains the dates of the flights. With a double-click on the desired folder you get to the next subdirectory. |
|
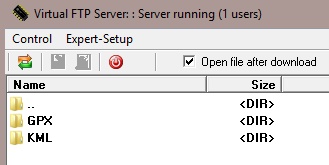
Here you always find 2 folders. GPX and KML. To get to the logfiles, you double-click on the folder GPX. |
|
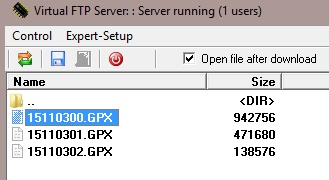
In this directory you find the recorded logfiles. If the Kopter recorded more flights on that day, you will find more logfiles in this directory. Just like the previous folders the names of the logfiles contains the different times of the flights. |
![]() For larger files the download can take several minutes. If you want to download faster, you have to remove the SD-card from the NaviCtrl and read it directly with your PC.
For larger files the download can take several minutes. If you want to download faster, you have to remove the SD-card from the NaviCtrl and read it directly with your PC.
The Menu
File
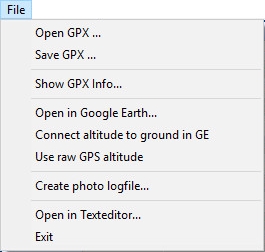
Open GPX
-> To open a logfile (*.GPX)
Save GPX
-> To save a logfile as CSV
Show GPX
-> Shows information about the opened logfile (e.g. occured errors)
Open in Google Earth
-> Opens Google Earth and displays the flight
Connect altitude to Ground in GE
-> With this option activated, the height will be connected to the ground in Google Earth.
Use raw GPS altitude
-> With this option activated, Google Earth is using the recorded GPS-height for the display instead of the value recorded by the pressure-sensor.
Create photo logfile ...
-> To create an export-file for Agisoft Photoscan and Pix4D
Open in Texteditor ...
-> Opens the GPX-file in a texteditor
Exit
-> Closes the GPX-Viewer
Charts

Add user chart
-> You can simply create an own chart and add the desired values here
Select chart files
-> Displays charts located in the mainfolder of the GPX-Viewer.
Options
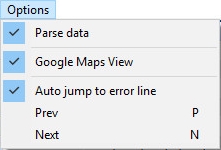
Parse data
-> Measured Values will be adjusted for a better display.
Google Maps View
-> Flight will be displayed on a Google Maps card.
Auto jump to error line
-> If there is a recorded error in the logfile, the GPX-Viewer jumps to the location of the first error.
Prev
-> Jumps to the previous error
Next
-> Jumps to the next Error
Windows
Show all Charts ...
-> Shows all Charts
Hide all Charts ...
-> Hides all Charts
- You can activate / deactivate single charts as well underneath this option.
The logfile


Value for the Latitude shown in decimal degree


Value for the Longitude shown in decimal degree


Hight-value of the GPS


Raw Hight-value of the GPS


UTC time of the GPS


Number of received Satellites


Barometric height measured by the pressure sensor


rate of rising/falling (in m/s)


GPS course over ground (independent from the compass of the MK)


ground speed in m/sec


Vertical Speed in m/s


Flight duration in seconds


Lipo voltage in [V]


Lipo Current in [A]


Capacity in [mAh]


Quality of the PPM-Signal (not the signal strength in case on 2,4GHz receiver!)


First value: Yaw Gyro stabilized Compass signal
Second value: Compass signal (raw)
Third value: Compass setpoint (corrected with declination)
Fourth value: Gyro Compass corrected (declination)


actual Nick-angle in [°]


actual Roll-angle in [°]


Actual GPS-status


Actual FlightCtrl status


First value: actual gas value
Second value: estimated hoover gas


Display of the different ErrorCodes


Direction to the Target


Distance to the Target


current of the BL-Ctrls 1-12 in [0,1A]


temperature of the BL-Ctrls 1-12 in [1°C]


the sentence that the transmitter should speak


strength on the current magnet field in [%]. This is compared to the field during calibration. Should be at ~100% after calibration.


Actual messured inclination of the magnetic (compass) vector ; inclination error compared to the theoretic inclination at your location


"Motor Not Okay" counter for each motor. counts if a motor is blocked for example.


available maximum power of the BL-Ctrls (255 = 100%)


counter of Errors on the I2C bus to the BL-Ctrls


counter of Errors on the SPI bus


free analog inputs of the NC (1024 = 3,3V)


First value: (Poti-) Setpoint for the Nick Servo (Raw)
Second value: (Poti-) Setpoint for the Roll Servo (Raw)
Third value: POI-Nick control (Or Waypoint-Nick Setpoint) in [°]


First value: Name of the actual target-Waypoint (e.g. P12)
Second value: Number of the actual target-Waypoint
Third value: Amount of all Waypoints
Fourth value: Actual value of the Waypoint event


Shutter counter


current values of the RC-Sticks in this order: Nick; Roll ; Yaw ; Gas ; Poti 1-Poti8


First value: GPS-Update-Rate in 0.1Hz (50 = 5,0Hz)
Second value: GPSData_Flags
Third value: Type of Sat-fix


current influence of the GPS-control: Nick ; Roll ; Yaw ;
GPS-Modes:
'-' = no GPS fix
'/' = off
'?' = Coming home, but home Position unknown (goes to PH then)
'H' = Coming home
'W' = Flying Waypoints
'D' = Dynamic Position Hold
'P' = Position Hold
'm' = Manual controlled
Charts
You can display specific values of the recorded flight in a graphic. At the startup of the GPX-Viewer this value will be opened automatically. If not you can activate one specific Value or all under the "Windows" tab.
Following charts are already included:
create own Graphs
![]() The .ini - file name must begin with "Charts-".
The .ini - file name must begin with "Charts-".
Magnetfield over Current
For example in the configuration file: "Charts-MagentFehler.ini" Here is the magnet field drawn over the current.
- [Chart1] ChartX = "Current" ChartYMax = 140 ChartYMin = 60
ChartType = "Point"
ChartName = "X-Achse = Strom"
Example: show the capacity
Create a "Charts-Capacity.ini" with the following content:
[Chart1]
ChartName = "mAh"
Series1Ident = "Capacity"
Series1Name = "mAh"
That shows the used capacity over the flight time.
Export Geodata
In the newest version of the GPX-Viewer it is possible to export the Geodata in the correct format to Pix4D and Agisoft Photoscan.
![]() Please use our CamTriggerTool when using a FlightCtrl V3 with (or without) external hot shoe adapter !
Please use our CamTriggerTool when using a FlightCtrl V3 with (or without) external hot shoe adapter !
How to:
Click on File ->Create photo logfile...
In the following window you set the row, where the first picture was taken. You can see this under the column [ShutterCnt] |
Below you choose the first Photo which was made in the Waypoint flight. |
From here on it continues in the appropriate program.
Agisoft Photoscan
Are the photos loaded into Agisoft Photoscan click in the Tab "Reference" on the symbol for the import of Geoinformation. |
Pix4D
With a click on "From File..." you can load the file you created with the GPX-viewer. When its done, you get a green ckeck mark as confirmation. |


